The purpose of this article is to get you started with a SciKit image processing tool by showing you how easy it is to install it. If you didn’t already know, “SciKits (short for SciPy Toolkits), are add-on packages for SciPy”. Each is a powerful scientific Python tool that can be installed with the Python package management system (pip).
To make it easy, SciPy.org has the user install the full SciPy stack. Otherwise, you can install each each package on their own. Because this is a full package installation, it will include SciPy and Numpy, as well as matplotlib, sympy, and many other useful packages. Once installed, you can download the different toolkits.
As with any Linux installation, start out with the usual updating procedures.
sudo apt updateOnce updated, the next step is to install the entire stack. Keep in mind, this is a big installation (around 2GB):
sudo apt install python-numpy python-scipy python-matplotlib ipython ipython-notebook python-pandas python-sympy python-noseAnd install Python’s package manager if you haven’t already:
sudo apt install python-pipBefore installing the SciKit, we’ll need to also install a tool called Networkx. At least I did on my machine. According to Udacity, NetworkX can be used to plot network graphs with python code. NetworkX is a Python language software package for the creation, manipulation, and study of the structure, dynamics, and functions of complex networks.
sudo apt install python-networkxNow with the stack updated, let’s install the image processing tool via the Python package management system:
sudo pip install -U scikit-imageThis tool is very powerful and I’m personally using it for some image analysis looking for specific structures in polymers I’m currently studying. Once you have it installed, save the following as something like, ‘contour.py’ by running the following command from a specified directory:
nano contour.pySave the following text to it:
import numpy as np
import matplotlib.pyplot as plt
from skimage import measure

# Construct some test data
x, y = np.ogrid[-np.pi:np.pi:100j, -np.pi:np.pi:100j]
r = np.sin(np.exp((np.sin(x)**3 + np.cos(y)**2)))
# Find contours at a constant value of 0.8
contours = measure.find_contours(r, 0.8)
# Display the image and plot all contours found
fig, ax = plt.subplots()
ax.imshow(r, interpolation='nearest', cmap=plt.cm.gray)
for n, contour in enumerate(contours):
    ax.plot(contour[:, 1], contour[:, 0], linewidth=2)
    ax.axis('image')
    ax.set_xticks([])
    ax.set_yticks([])
    plt.show()
Run the file once you’ve saved it.
python contour.py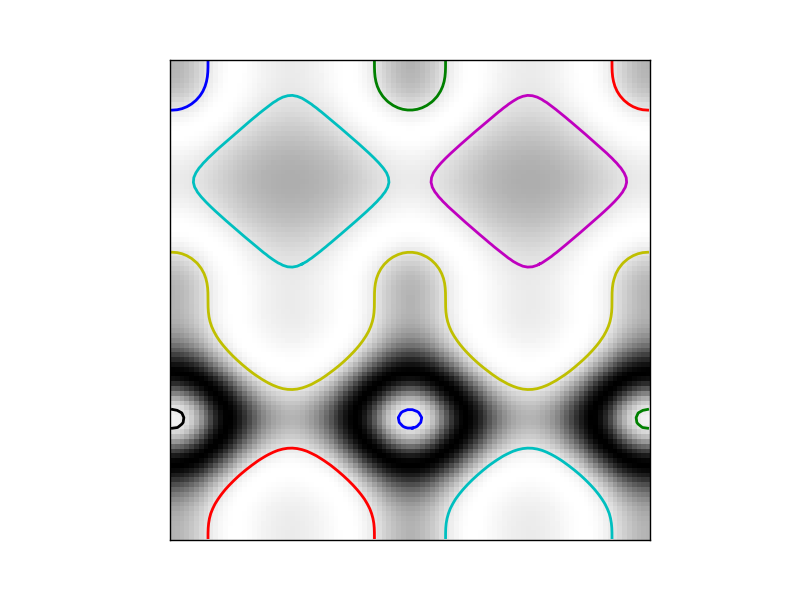
That’s it! Of course you’ll have to tweak the file to read your image a bit, but I’ll leave that up to the reader as an exercise.
-ade