Introduction:
Have you ever wondered what’s happening under the hood of your computer? I recently found myself on a quest to monitor CPU and memory usage on my computer, and what I thought would be a straightforward task turned into an exciting adventure in Python scripting. In short, Linux computers already have such processes that can display this information. Be it “top” or “htop”. I wanted to see if I could write my own version using ChatGPT, without writing any code myself as a short exercise.
The Initial Challenge:
The journey began with a simple goal: to keep tabs on my computer’s CPU and memory usage. We all know that technology can be a bit unpredictable, and having real-time insights into how our systems are performing can be invaluable.
However, the road to achieving this was not as smooth as I had hoped. My initial attempts at monitoring CPU and memory usage were met with roadblocks. I quickly realized that the tools at my disposal were limited and lacked the real-time updates I desired.
The First Attempts:
Undeterred, I embarked on a series of trials with different Python scripts. While each attempt got me a step closer to my goal, there were always shortcomings. Some scripts provided CPU usage data but lacked memory information. Others could display memory stats but didn’t update in real-time.
The Quest for the Perfect Script:
With each iteration of the prompt engineering (I don’t actually know what we call this yet), I became more determined to create the perfect script. It had to meet my specific requirements: real-time updates, a visually appealing display, and the ability to monitor both CPU and memory usage simultaneously.
The Collaboration with the AI:
Working with GPT-3 was like having a coding partner who never got tired. I even had it write this article! I could describe my needs, ask for code snippets, and iterate on the results. It was a collaborative experience that pushed my project forward in ways I hadn’t imagined.
The Final Script:
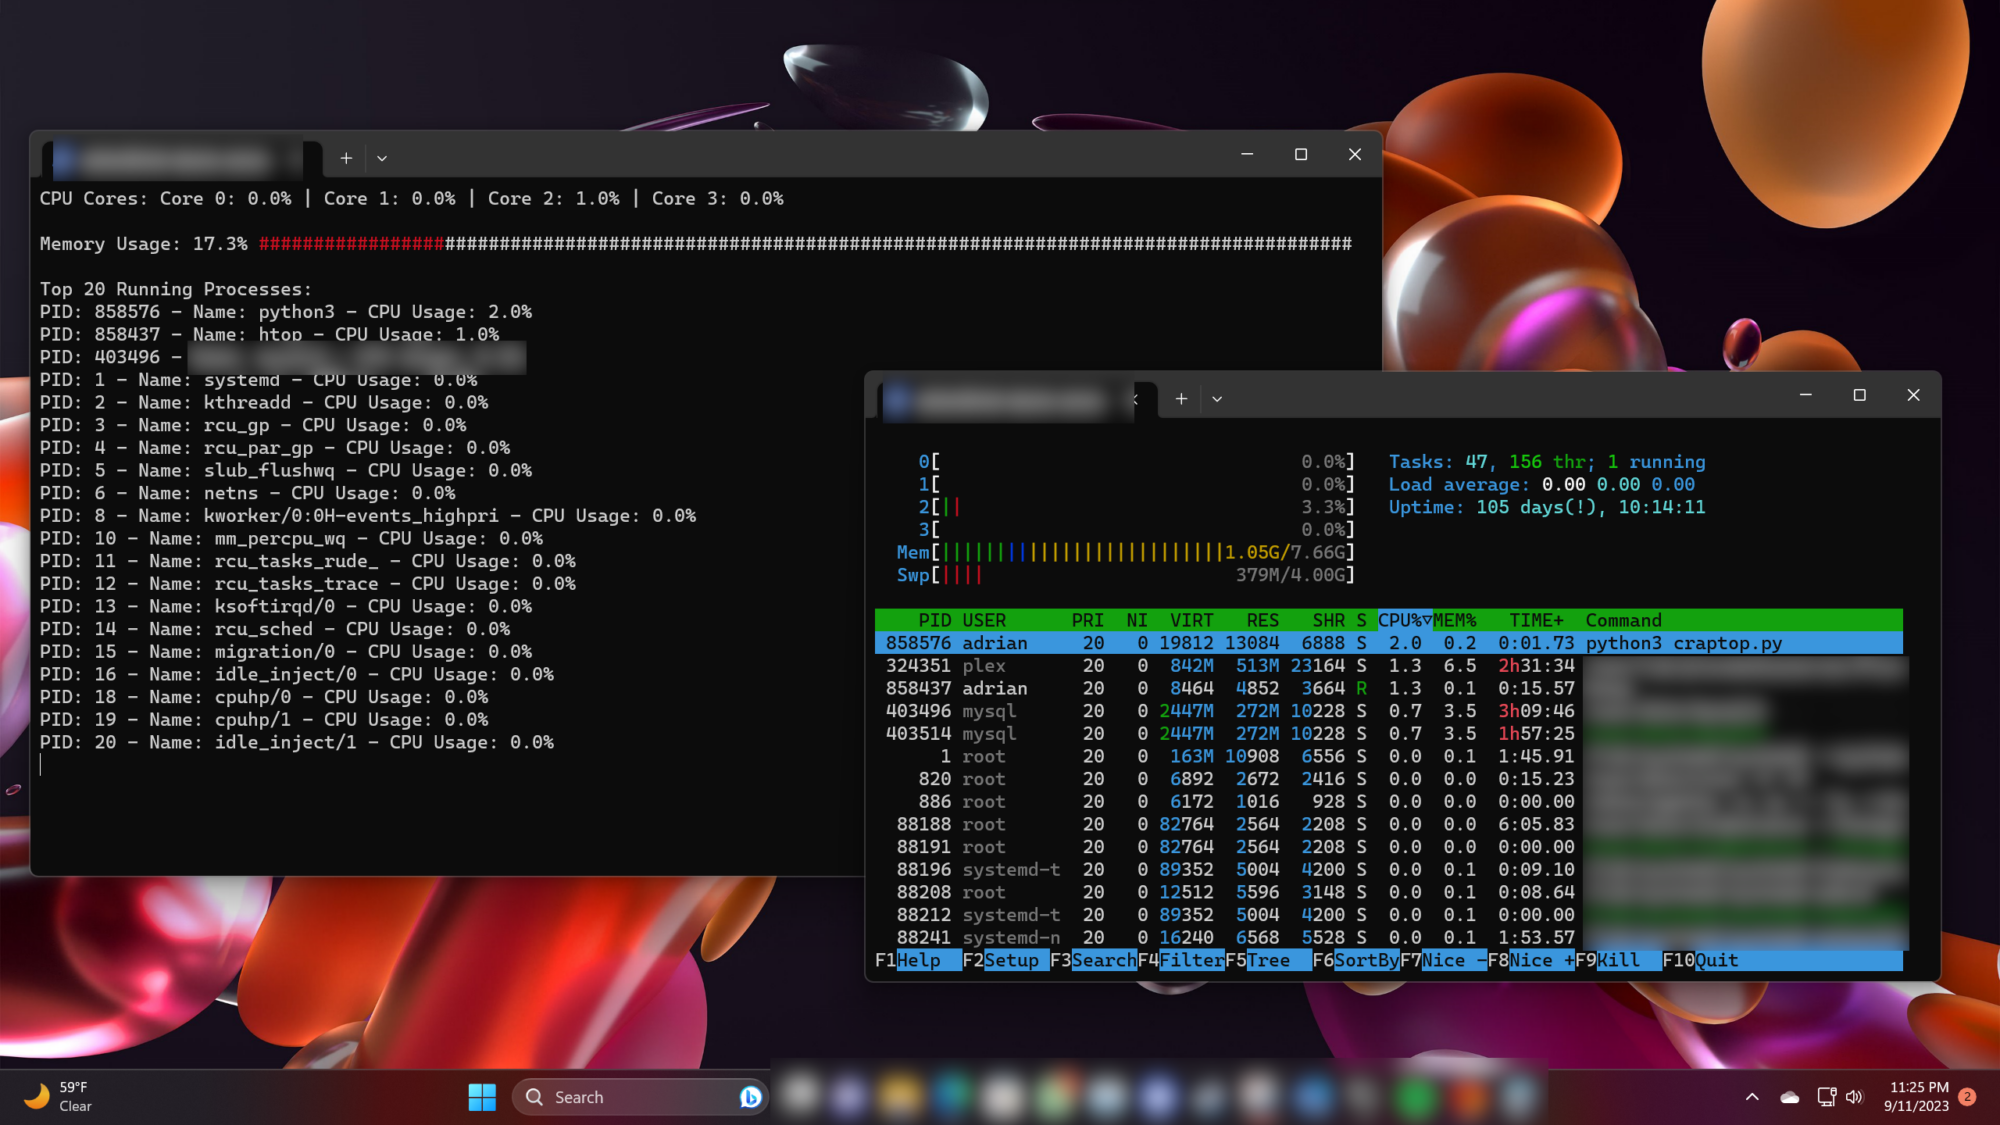
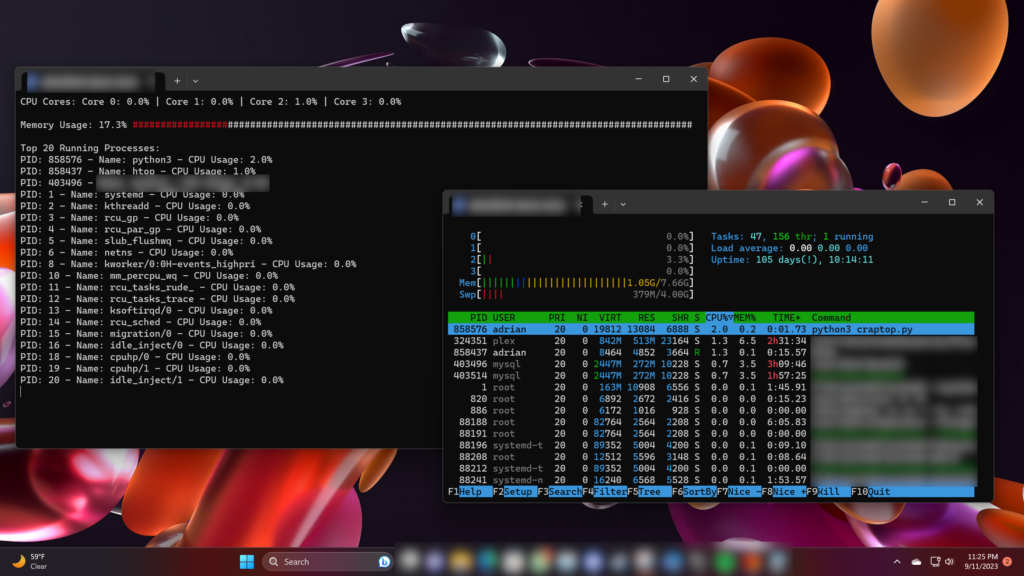
After several interactions with GPT-3, I finally had a Python script that met all my requirements. It displayed CPU core usage, memory usage, and the top processes running on my system—all in real-time. It was the script I had been searching for. At least version 1…
"""
MIT License

Copyright (c) 2023 Adrian Sanabria-Diaz

Permission is hereby granted, free of charge, to any person obtaining a copy
of this software and associated documentation files (the 'Software'), to deal
in the Software without restriction, including without limitation the rights
to use, copy, modify, merge, publish, distribute, sublicense, and/or sell
copies of the Software, and to permit persons to whom the Software is
furnished to do so, subject to the following conditions:

The above copyright notice and this permission notice shall be included in all
copies or substantial portions of the Software.

THE SOFTWARE IS PROVIDED 'AS IS', WITHOUT WARRANTY OF ANY KIND, EXPRESS OR
IMPLIED, INCLUDING BUT NOT LIMITED TO THE WARRANTIES OF MERCHANTABILITY,
FITNESS FOR A PARTICULAR PURPOSE AND NONINFRINGEMENT. IN NO EVENT SHALL THE
AUTHORS OR COPYRIGHT HOLDERS BE LIABLE FOR ANY CLAIM, DAMAGES OR OTHER
LIABILITY, WHETHER IN AN ACTION OF CONTRACT, TORT OR OTHERWISE, ARISING FROM,
OUT OF OR IN CONNECTION WITH THE SOFTWARE OR THE USE OR OTHER DEALINGS IN THE
SOFTWARE.
"""
""" This is a crappy attempt at a worse TOP or HTOP running in Python """
import psutil
import time

# Title (displayed only once)
print("Adrian's CrapTOP")

while True:
    # Get CPU usage percentages for each core
    cpu_usage = psutil.cpu_percent(interval=1, percpu=True)

    # Get memory usage statistics
    memory_info = psutil.virtual_memory()

    # Get a list of the top 20 running processes by CPU usage
    top_processes = sorted(
        psutil.process_iter(attrs=['pid', 'name', 'cpu_percent']),
        key=lambda x: x.info['cpu_percent'],
        reverse=True)[:20]

    # Clear the terminal (works on Unix-like systems, modify for Windows)
    print("\033c", end='')

    # Print CPU usage for each core in a row
    print("CPU Cores:", end=' ')
    for i, core_usage in enumerate(cpu_usage):
        if i != 0:
            print("|", end=' ')
        print(f"Core {i}: {core_usage}%", end=' ')
    print()  # Newline after printing CPU cores

    # Calculate used and unused memory
    total_hashes = 100
    used_percent = memory_info.percent
    used_hashes_count = int(total_hashes * (used_percent / 100))
    unused_hashes_count = total_hashes - used_hashes_count
    used_hashes = "\033[31m" + "#" * used_hashes_count + "\033[0m"  # Red color for used memory
    unused_hashes = "#" * unused_hashes_count  # White # signs for unused memory

    # Print memory usage with percentage, red # signs for used memory, and white # signs for unused memory
    memory_usage = f"{used_percent}% {used_hashes}{unused_hashes}"
    print(f"\nMemory Usage: {memory_usage}")

    # Print top 20 running processes by CPU usage
    print("\nTop 20 Running Processes:")
    for process in top_processes:
        print(f"PID: {process.info['pid']} - Name: {process.info['name']} - CPU Usage: {process.info['cpu_percent']}%")

    # Sleep for 1 second before refreshing
    time.sleep(1)
Breaking Down the Code (At least ChatGPT’s interpretation)
Title (displayed only once): This is just a title that’s printed at the beginning to let you know what this program is called. In this case, it’s named “Adrian’s CrapTOP.”
Main Program (while True): The code inside the while True: loop is the main part of the program, and it keeps running forever unless you stop it manually.
Monitoring CPU Usage:
- It checks how busy your computer’s “brain” (the CPU) is by looking at each part of it (called cores).
- It then figures out how much work each core is doing and displays it as a percentage. For example, if a core is at 50%, it means it’s working at half its capacity.
Monitoring Memory Usage:
- It looks at how much “thinking space” your computer’s memory (RAM) is using.
- It calculates how much of the memory is being used compared to the total memory available and shows it as a percentage. For example, if it’s at 30%, it means 30% of your RAM is actively in use.
Displaying Memory Usage:
- It shows the memory usage as a percentage (e.g., 30%) and uses red
#signs to represent the part of memory in use. - It also uses white
#signs to show the part of memory that’s not currently being used.
Monitoring Top Processes:
- It looks at all the programs running on your computer and finds the 20 most active ones based on how much they’re using the CPU.
- It shows their names, how much CPU power they’re using, and a unique identifier called a “PID.”
Refreshing the Display:
- It clears the screen to give you a fresh view of the data (this works better on some types of computers).
- It waits for 1 second before checking everything again. This gives you real-time updates about your computer’s performance.
So, in simple terms, this code is like having a window into your computer’s brain (CPU) and memory. It tells you how busy they are and shows you the most active programs. It does all of this in a way that’s easy to understand with percentages and # signs. It keeps updating this information every second so you can see what your computer is up to in real-time.
Results and Benefits:
The benefits of the final script were immediate and impressive. Okay, this sentence isn’t ChatGPT but I kind of liked the fluff that it kept adding…
Wabam! A near indistinguishable (sarcasm) clone of top/htop written exclusively by ChatGPT, in Python, and runs twice as heavy as htop and displays less information! BUT… it does show memory usage as a function of # signs and the usage is displayed as a number and in red. That took me like 5 minutes of negotiating with ChatGPT to figure out. I also blurred out stuff (like for privacy reasons, some of the processes that were running).
I could now monitor my system’s performance effortlessly. Whether I was working on resource-intensive tasks or just curious about what was happening in the background, my Python script had me covered.
Code is above or on my GitHub below:
python_scripts/craptop.py at main · sigmaenigma/python_scripts (github.com)
Conclusion:
My journey from the initial challenge to the final solution taught me the power of scripting and automation in system monitoring. Python, combined with the assistance of GPT-3, had enabled me to create a tool that significantly improved my system management. Okay, this is a little much, so thanks if you’ve read this far.
That said, I encourage you to explore Python scripting for your own monitoring needs. It’s a rewarding adventure that can provide valuable insights into your computer’s performance.
Acknowledgments:
I’d like to extend my gratitude to OpenAI’s GPT-3 for its invaluable assistance in generating the script that made this project possible. Additionally, I want to thank the coding community for its ongoing support and inspiration. (It actually wrote that too… )